To use data from Reddit, a great source of data accessible with many methods, we will use the https://github.com/pushshift/api.
I put an example here in this notebook.
Import
First import this modules
import requests
import pandas
import textblob
import plotly.express as px
import nltk
then this:
nltk.download('punkt')
pandas.set_option('display.max_colwidth', -1) # don't cut my pandas dataframes
# define variables

COMMENT_COLOR         = "darkgreen"
SUBMISSION_COLOR      = "darkorange"
TEXT_PREVIEW_SIZE     = 240
TERM_OF_INTEREST      = "python"
SUBREDDIT_OF_INTEREST = "python"
TIMEFRAME             = "48h" # see more options in the pushshift api docs: https://github.com/pushshift/api
# a couple of helper functions
Function to get a json format for the data you look for
def get_pushshift_data(data_type, **kwargs):
"Get data from the API in form of a json file, passing the data_type"
base_url = f"https://api.pushshift.io/reddit/search/{data_type}/"
payload = kwargs
request = requests.get(base_url, params=payload)
return request.json()
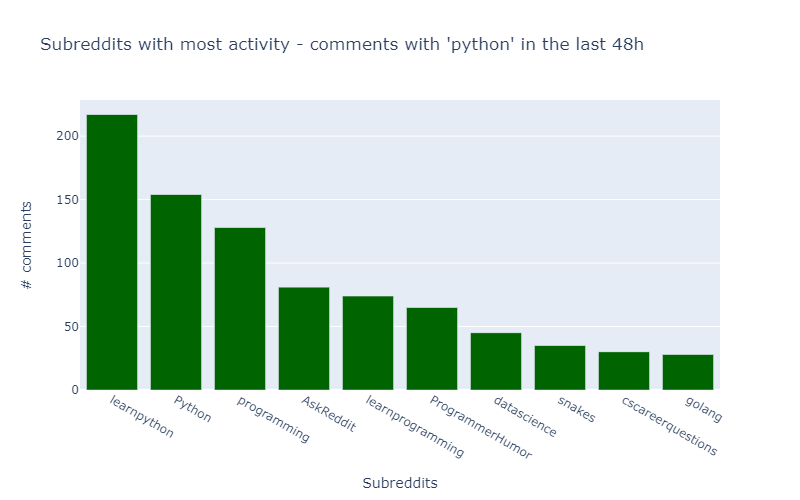
data = get_pushshift_data(data_type="comment", q=TERM_OF_INTEREST, after=TIMEFRAME, size=1000, aggs="subreddit").get("aggs").get("subreddit")
Show the data
df = pandas.DataFrame.from_records(data)[0:10]

fig = px.bar(df,
       x="key",
       y="doc_count",
       title=f"Subreddits with most activity - comments with '{TERM_OF_INTEREST}' in the last {TIMEFRAME}",
       labels={"doc_count": "# comments","key": "Subreddits"},
       color_discrete_sequence=[COMMENT_COLOR],
       height=500,
       width=800)
fig.show()
The output