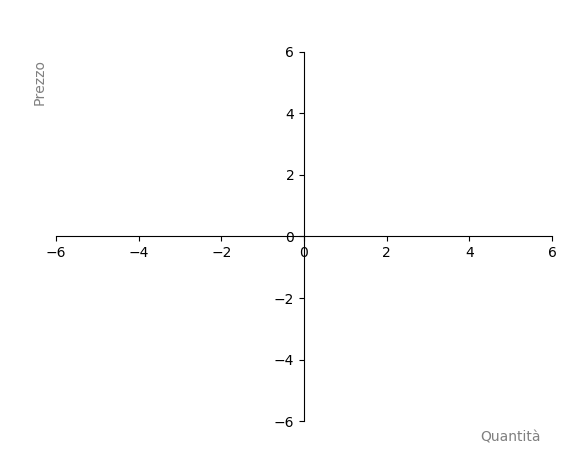
Draw axis
To draw axis, you can do this:
import matplotlib.pyplot as plt
import matplotlib as mpl

def axis():
	fig, ax = plt.subplots()
	# Etichetta X
	ticklab = ax.xaxis.get_ticklabels()[0]
	trans = ticklab.get_transform()
	ax.xaxis.set_label_coords(5,0, transform=trans)
	# Etichetta Y
	ticklab = ax.yaxis.get_ticklabels()[0]
	trans = ticklab.get_transform()
	ax.yaxis.set_label_coords(0,5, transform=trans)

	ax.spines['left'].set_position('center')
	ax.spines['bottom'].set_position('center')
	ax.spines['right'].set_color('none')
	ax.spines['top'].set_color('none')
	ax.xaxis.tick_bottom()
	plt.axis([-6 , 6, -6, 6])
	plt.ylabel('Prezzo').set_color('gray')
	plt.xlabel('Quantità').set_color('gray')
	plt.show()

axis()
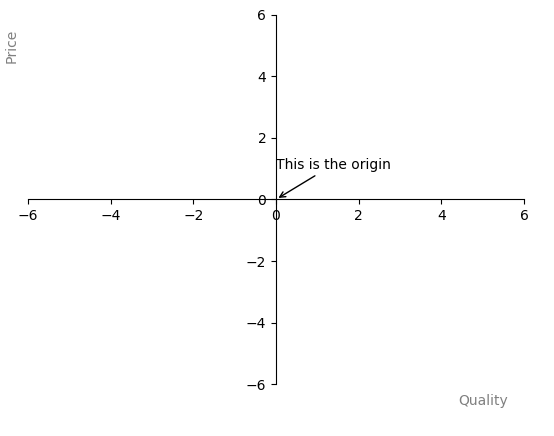
Adding some text on the screen
If you want to add some text like a legend with an arrow pointing to the point you need to explain what is it, you can use annotate.
import matplotlib.pyplot as plt
import matplotlib as mpl

def axes(x,y):
	fig, ax = plt.subplots()
	# Etichetta X
	ticklab = ax.xaxis.get_ticklabels()[0]
	trans = ticklab.get_transform()
	ax.xaxis.set_label_coords(5,0, transform=trans)
	# Etichetta Y
	ticklab = ax.yaxis.get_ticklabels()[0]
	trans = ticklab.get_transform()
	ax.yaxis.set_label_coords(0,5, transform=trans)

	# arrows
	ax.annotate("This is the origin", xy=(0, 0), xytext=(0, 1), arrowprops=dict(arrowstyle="->"))

	ax.spines['left'].set_position('center')
	ax.spines['bottom'].set_position('center')
	ax.spines['right'].set_color('none')
	ax.spines['top'].set_color('none')
	ax.xaxis.tick_bottom()
	plt.axis([-6 , 6, -6, 6])
	plt.ylabel(x).set_color('gray')
	plt.xlabel(y).set_color('gray')

axes(x = "Price", y="Quality")
if __name__ == "__main__":
	plt.show()
You will have this:
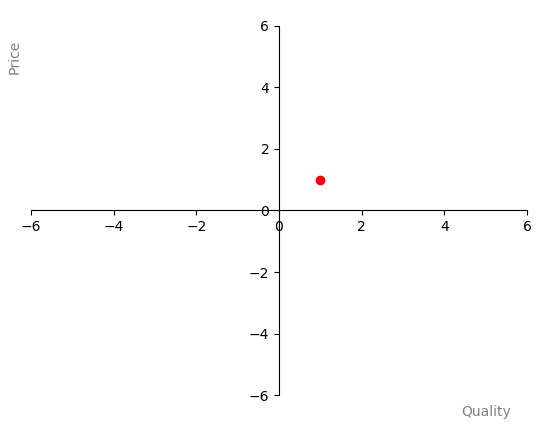
Add a point
import matplotlib.pyplot as plt
import matplotlib as mpl

def axes(x,y):
	fig, ax = plt.subplots()
	# Etichetta X
	ticklab = ax.xaxis.get_ticklabels()[0]
	trans = ticklab.get_transform()
	ax.xaxis.set_label_coords(5,0, transform=trans)
	# Etichetta Y
	ticklab = ax.yaxis.get_ticklabels()[0]
	trans = ticklab.get_transform()
	ax.yaxis.set_label_coords(0,5, transform=trans)

	# arrows
	#ax.annotate("This is the origin", xy=(0, 0), xytext=(0, 1), arrowprops=dict(arrowstyle="->"))

	ax.spines['left'].set_position('center')
	ax.spines['bottom'].set_position('center')
	ax.spines['right'].set_color('none')
	ax.spines['top'].set_color('none')
	ax.xaxis.tick_bottom()
	plt.axis([-6 , 6, -6, 6])
	plt.ylabel(x).set_color('gray')
	plt.xlabel(y).set_color('gray')
	plt.plot(1,1, 'ro')

axes(x = "Price", y="Quality")
if __name__ == "__main__":
	plt.show()
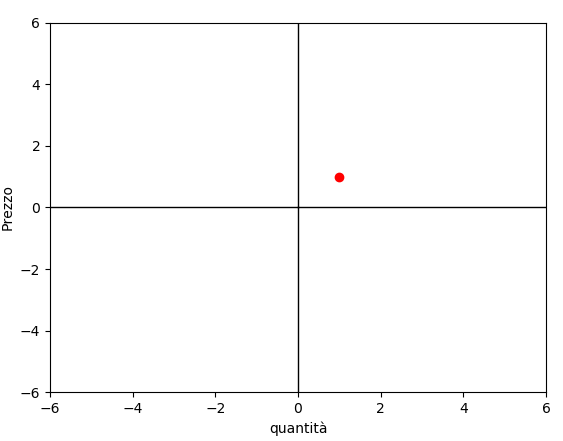
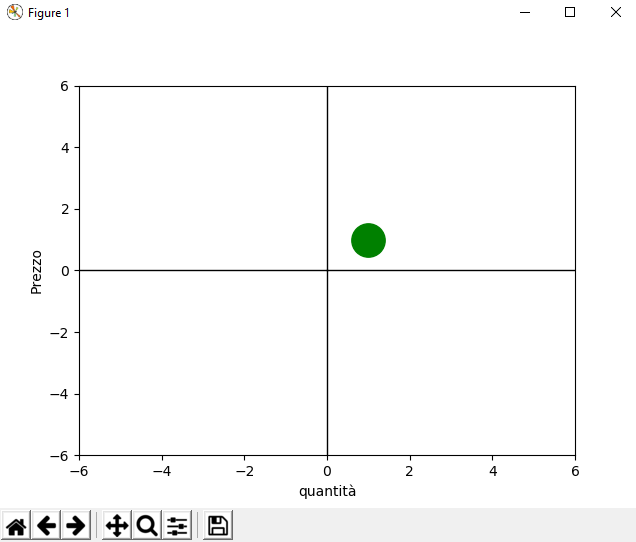
A different way
Let’s do something basic. Draw a point with some coordinates.
import matplotlib.pyplot as plt


def point(axis=0):
	plt.plot([1], [1], 'ro')
	plt.ylabel('Prezzo')
	plt.xlabel('quantità')

def axis():
	plt.plot([0,-6], [0, 0], 'k', lw=1)
	plt.plot([0,0], [0, 6], 'k', lw=1)
	plt.plot([0,0], [0, -6], 'k', lw=1)
	plt.plot([6,0], [0,0], 'k', lw=1)
	plt.axis([-6 , 6, -6, 6])
	plt.ylabel('Prezzo')
	plt.xlabel('Quantità')


axis()
point()
plt.show()
The result is this:
Color and size with color and markersize
This will change the size and the color of our dot.
def point(axis=0):
	plt.plot([1], [1], 'ro', color='green', markersize=24)
	plt.ylabel('Prezzo')
	plt.xlabel('quantità')
Let’s say we have this table
| OFFERTA | Posti | Qualità | Prezzi |
| Ristorante Alba | 50 | 0 | -3 |
| Ristorante Baia | 60 | 3 | -2 |
| Ristorante Calice | 120 | -4 | -1 |
| Ristorante Delice | 50 | -3 | -2 |
| Ristorante Elena | 60 | -4 | -1 |
| DOMANDA | Qualità | Prezzi | |
| "Privati" | 25 | [-4] | [-1] |
| "Banchetti" | 25 | [2] | [2] |
| "Turisti" | 50 | [3] | [0] |
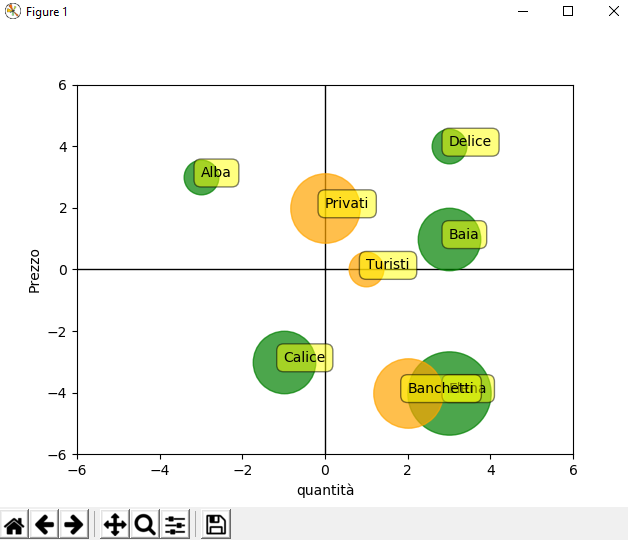
Now lets do something more fun
import matplotlib.pyplot as plt


def point(name, size, x, y, color):
	plt.plot(x, y, 'ro', color=color, markersize=size/2, alpha=0.7)
	plt.ylabel('Prezzo')
	plt.xlabel('quantità')
	plt.annotate(name, xy=(x,y),bbox=dict(boxstyle='round,pad=0.5', fc='yellow', alpha=0.5))

def axis():
	plt.plot([0,-6], [0, 0], 'k', lw=1)
	plt.plot([0,0], [0, 6], 'k', lw=1)
	plt.plot([0,0], [0, -6], 'k', lw=1)
	plt.plot([6,0], [0,0], 'k', lw=1)
	plt.axis([-6 , 6, -6, 6])
	plt.ylabel('Prezzo')
	plt.xlabel('Quantità')

a = """
Ristorante Alba	50	-3	3
Ristorante Baia	90	3	1
Ristorante Calice	90	-1	-3
Ristorante Delice	50	3	4
Ristorante Elena	120	3	-4
"""

b = """
"Privati"	40	[0]	[2]
"Banchetti"	40	[2]	[-4]
"Turisti"	20	[1]	[0]
"""


def list_it(a):
	a = a.replace("\"","").replace("[","").replace("]","")
	a = a.splitlines()[1:]
	for n,x in enumerate(a):
		a[n] = a[n].split()
	return a
a = list_it(a)
b = list_it(b)


axis()

for r in a:
	point(r[1], int(r[2]), int(r[3]), int(r[4]), 'green')
for r in b:
	point(r[0], int(r[1])*2.5, int(r[2]), int(r[3]), 'orange')


plt.show()
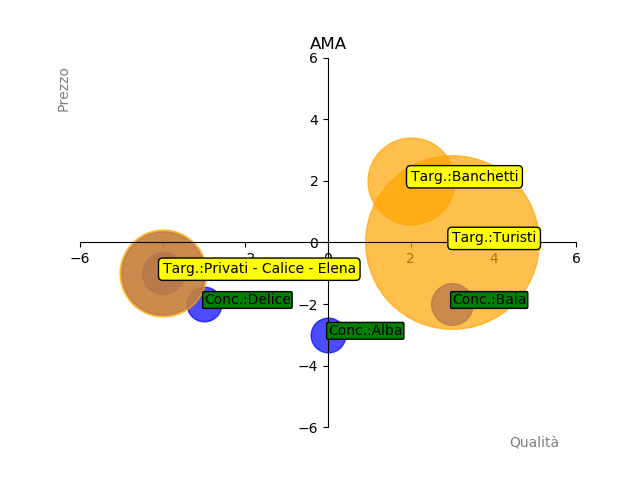
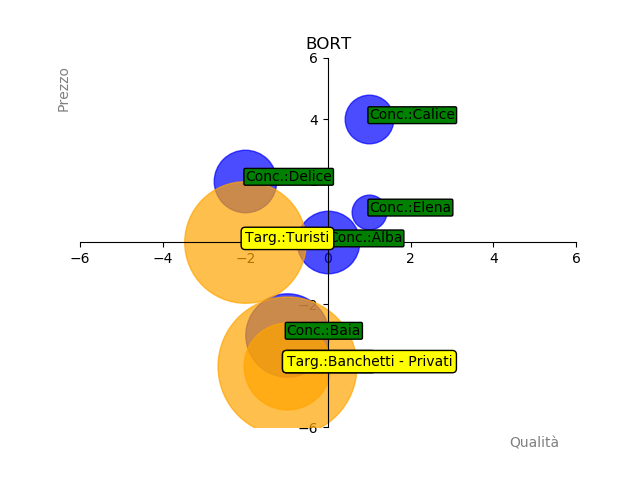
More graphs
With this code we can add more data for more situations, creating one graph for each data. If some data are in the same spot, they will show in the same label the names that share the same spot.
import matplotlib.pyplot as plt
from random import random

def axes(x,y, name):
	fig, ax = plt.subplots()
	# Etichetta X
	ax.set_title(name)
	ax.ticklabel_format(axis='both', style='plain', scilimits=(0,0))
	ticklab = ax.xaxis.get_ticklabels()[0]
	trans = ticklab.get_transform()
	ax.xaxis.set_label_coords(5,0, transform=trans)
	# Etichetta Y
	ticklab = ax.yaxis.get_ticklabels()[0]
	trans = ticklab.get_transform()
	ax.yaxis.set_label_coords(0,5, transform=trans)

	# arrow
	#ax.annotate("This is the origin", xy=(0, 0), xytext=(0, 1), arrowprops=dict(arrowstyle="->"))

	ax.spines['left'].set_position('center')
	ax.spines['bottom'].set_position('center')
	ax.spines['right'].set_color('none')
	ax.spines['top'].set_color('none')
	ax.xaxis.tick_bottom()
	axis = [-6, 6, -6, 6]
	plt.axis(axis, axis*2)
	#plt.yticks(axis, ["a","b","c", "d"] )#(-6,-5,-4,-3,-2,-1,0,1,2,3,4,5,6))
	plt.ylabel(x).set_color('gray')
	plt.xlabel(y).set_color('gray')

def annotate(name, x, y):
	plt.annotate(name, xy=(x,y),bbox=dict(boxstyle='round,pad=0.1', fc='green', alpha=0.7))

def annotate2(name, x, y):
	plt.annotate(name, xy=(x,y),bbox=dict(boxstyle='round,pad=0.3', fc='yellow', alpha=0.7))

def point(name, size, x, y, color):
	plt.plot(x, y, 'ro', color=color, markersize=size/2, alpha=0.7)
	for t in xy:
		if [x,y] == t[0]:
			if name not in name:
				name = name + " e " + t[1]
	xy.append([[x,y], name])
	if "Conc" not in name:
		name = "Conc.:" + name
	annotate(name, x, y)
xy = []
def point2(name, size, x, y, color):
	plt.plot(x, y, 'ro', color=color, markersize=size, alpha=0.7)
	for t in xy:
		if [x,y] == t[0]:
			name = name + " - " + t[1]
	xy.append([[x,y], name])
	if "Targ:" not in name:
		name = "Targ.:" + name
	annotate2(name,x,y)


class Alunni:
	dict = {}
	def __init__(self, name, offerta, domanda):
		self.name = name
		self.offerta = offerta
		self.domanda = domanda
		Alunni.dict[name] = self


def list_it(a):
	a = a.replace("\"","").replace("[","").replace("]","")
	a = a.splitlines()[1:]
	for n,x in enumerate(a):
		a[n] = a[n].split()
	return a
# ========================= alunni =====================
Ama_restaurant = Alunni("AMA",
"""
Ristorante Alba	    50	0	-3
Ristorante Baia	    60	3	-2
Ristorante Calice	120	-4	-1
Ristorante Delice	50	-3	-2
Ristorante Elena	60	-4	-1
""",

"""
"Privati"	25	[-4] [-1]
"Banchetti"	25	[2]	 [2]
"Turisti"	50	[3]	 [0]
""")

Bort_restaurant = Alunni("BORT",
	"""
Ristorante Alba	90	0	0
Ristorante Baia	120	-1	-3
Ristorante Calice	70	1	4
Ristorante Delice	90	-2	2
Ristorante Elena	50	1	1
""",
"""
"Privati"	40	[-1]	[-4]
"Banchetti"	25	[-1]	[-4]
"Turisti"	35	[-2]	[0]
"""
)
# ========================================================


def start(name, o, d):
	global a,b
	nome, a,b = name, o, d
	a = list_it(a)
	b = list_it(b)
	axes(x="Prezzo", y="Qualità", name=nome)
	for r in a:
		point(r[1], int(r[2]), int(r[3]), int(r[4]), 'blue')
	for r in b:
		point2(r[0], int(r[1])*2.5, int(r[2]), int(r[3]), 'orange')

for k in Alunni.dict:
	start(Alunni.dict[k].name, Alunni.dict[k].offerta, Alunni.dict[k].domanda)
	xy = []
plt.show()
Seamless Theme René, made by Altervista
Create a website and earn with Altervista - Disclaimer - Report Abuse - Privacy Policy - Customize advertising tracking